#!/usr/bin/env python
# -*- coding: utf-8 -*-
"""Some data related viewer."""
import matplotlib.pyplot as plt
import numpy as np
from matplotlib.collections import PatchCollection
from matplotlib.colors import LogNorm, Normalize
from matplotlib.patches import Rectangle, Wedge
import pygimli as pg
from .utils import updateAxes as updateAxes_
[docs]def generateMatrix(xvec, yvec, vals, **kwargs):
"""Generate a data matrix from x/y and value vectors.
Parameters
----------
xvec, yvec, vals : iterables (list, np.array, pg.RVector) of same length
full: bool [False]
generate a fully symmetric matrix containing all unique xvec+yvec
otherwise A is squeezed to the individual unique vectors
Returns
-------
A : np.ndarray(2d)
matrix containing the values sorted according to unique xvec/yvec
xmap/ymap : dict {key: num}
dictionaries for accessing matrix position (row/col number from x/y[i])
"""
if kwargs.pop('full', False):
xymap = {xy: ii
for ii, xy in enumerate(np.unique(np.hstack((xvec, yvec))))}
xmap = xymap
ymap = xymap
else:
xu, yu = np.unique(xvec), np.unique(yvec)
if kwargs.pop('fillx', False):
print('filling x', len(xu))
dx = np.median(np.diff(xu)).round(1)
xu = np.arange(0, xu[-1] - xu[0] + dx * 0.5, dx) + xu[0]
print(len(xu))
if kwargs.pop('filly', False):
dy = np.median(np.diff(yu)).round(1)
yu = np.arange(0, yu[-1] - yu[0] + dy * 0.5, dy) + yu[0]
xmap = {xx: ii for ii, xx in enumerate(xu)}
ymap = {yy: ii for ii, yy in enumerate(yu)}
A = np.zeros((len(ymap), len(xmap)))
inot = []
nshow = min([len(xvec), len(yvec), len(vals)])
for i in range(nshow):
xi, yi = xvec[i], yvec[i]
if A[ymap[yi], xmap[xi]]:
inot.append(i)
A[ymap[yi], xmap[xi]] = vals[i]
if len(inot) > 0:
print(len(inot), "data of", nshow, "not shown")
if len(inot) < 30:
print(inot)
return A, xmap, ymap
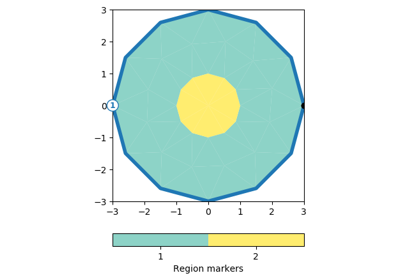
[docs]def patchValMap(vals, xvec=None, yvec=None, ax=None, cMin=None, cMax=None,
logScale=None, label=None, dx=1, dy=None, cTrim=0, **kwargs):
"""Plot previously generated (generateVecMatrix) y map (category).
Parameters
----------
vals : iterable
Data values to show.
xvec : dict {i:num}
dict (must match vals.shape[0])
ymap : iterable
vector for x axis (must match vals.shape[0])
ax : mpl.axis
axis to plot, if not given a new figure is created
cMin/cMax : float
minimum/maximum color values
cTrim : float [0]
use trim value to exclude outer cTrim percent of data from color scale
logScale : bool
logarithmic colour scale [min(vals)>0]
label : string
colorbar label
** kwargs:
* circular : bool
Plot in polar coordinates.
"""
if cMin is None:
cMin = np.min(vals)
# cMin = np.nanquantile(vals, cTrim/100)
if cMax is None:
cMax = np.max(vals)
# cMin = np.nanquantile(vals, 1-cTrim/100)
if logScale is None:
logScale = (cMin > 0.0)
norm = None
if logScale and cMin > 0:
norm = LogNorm(vmin=cMin, vmax=cMax)
else:
norm = Normalize(vmin=cMin, vmax=cMax)
if ax is None:
ax = plt.subplots()[1]
recs = []
circular = kwargs.pop('circular', False)
if circular:
recs = [None] * len(xvec)
if dy is None: # map y values to unique
ymap = {xy: ii for ii, xy in enumerate(np.unique(yvec))}
xyMap = {}
for i, y in enumerate(yvec):
if y not in xyMap:
xyMap[y] = []
xyMap[y].append(i)
# maxR = max(ymap.values()) # what's that for? not used
dR = 1 / (len(ymap.values())+1)
# dOff = np.pi / 2 # what's that for? not used
for y, xIds in xyMap.items():
r = 1. - dR*(ymap[y]+1)
# ax.plot(r * np.cos(xvec[xIds]),
# r * np.sin(xvec[xIds]), 'o')
# print(y, ymap[y])
for i in xIds:
phi = xvec[i]
# x = r * np.cos(phi) # what's that for? not used
y = r * np.sin(phi)
dPhi = (xvec[1] - xvec[0])
recs[i] = Wedge((0., 0.), r + dR/1.5,
(phi - dPhi)*360/(2*np.pi),
(phi + dPhi)*360/(2*np.pi),
width=dR,
zorder=1+r)
# if i < 5:
# ax.text(x, y, str(i))
# pg.wait()
else:
raise("Implementme")
else:
if dy is None: # map y values to unique
ymap = {xy: ii for ii, xy in enumerate(np.unique(yvec))}
for i in range(len(vals)):
recs.append(Rectangle((xvec[i] - dx / 2, ymap[yvec[i]] - 0.5),
dx, 1))
else:
for i in range(len(vals)):
recs.append(Rectangle((xvec[i] - dx / 2, yvec[i] - dy / 2),
dx, dy))
ax.set_xlim(min(xvec) - dx / 2, max(xvec) + dx / 2)
ax.set_ylim(len(ymap) - 0.5, -0.5)
pp = PatchCollection(recs)
# ax.clear()
col = ax.add_collection(pp)
pp.set_edgecolor(None)
pp.set_linewidths(0.0)
if 'alpha' in kwargs:
pp.set_alpha(kwargs['alpha'])
if circular:
pp.set_edgecolor('black')
pp.set_linewidths(0.1)
cmap = pg.mplviewer.cmapFromName(**kwargs)
if kwargs.pop('markOutside', False):
cmap.set_bad('grey')
cmap.set_under('darkgrey')
cmap.set_over('lightgrey')
cmap.set_bad('black')
pp.set_cmap(cmap)
pp.set_norm(norm)
pp.set_array(vals)
pp.set_clim(cMin, cMax)
updateAxes_(ax)
cbar = kwargs.pop('colorBar', True)
ori = kwargs.pop('orientation', 'horizontal')
if cbar in ['horizontal', 'vertical']:
ori = cbar
cbar = True
if cbar is True: # not for cbar=1, which is really confusing!
cbar = pg.mplviewer.createColorBar(col, cMin=cMin, cMax=cMax,
nLevs=5, label=label,
orientation=ori)
elif cbar is not False:
# .. cbar is an already existing cbar .. so we update its values
pg.mplviewer.updateColorBar(cbar, cMin=cMin, cMax=cMax,
nLevs=5, label=label)
updateAxes_(ax)
return ax, cbar, ymap
[docs]def patchMatrix(mat, xmap=None, ymap=None, ax=None, cMin=None, cMax=None,
logScale=None, label=None, dx=1, **kwargs):
"""Plot previously generated (generateVecMatrix) matrix.
Parameters
----------
mat : numpy.array2d
matrix to show
xmap : dict {i:num}
dict (must match A.shape[0])
ymap : iterable
vector for x axis (must match A.shape[0])
ax : mpl.axis
axis to plot, if not given a new figure is created
cMin/cMax : float
minimum/maximum color values
logScale : bool
logarithmic colour scale [min(A)>0]
label : string
colorbar label
dx : float
width of the matrix elements (by default 1)
"""
mat = np.ma.masked_where(mat == 0.0, mat, False)
if cMin is None:
cMin = np.min(mat)
if cMax is None:
cMax = np.max(mat)
if logScale is None:
logScale = (cMin > 0.0)
if logScale:
norm = LogNorm(vmin=cMin, vmax=cMax)
else:
norm = Normalize(vmin=cMin, vmax=cMax)
if 'ax' is None:
ax = plt.subplots()[1]
iy, ix = np.nonzero(mat) # != 0)
recs = []
vals = []
for i, _ in enumerate(ix):
recs.append(Rectangle((ix[i] - dx / 2, iy[i] - 0.5), dx, 1))
vals.append(mat[iy[i], ix[i]])
pp = PatchCollection(recs)
col = ax.add_collection(pp)
pp.set_edgecolor(None)
pp.set_linewidths(0.0)
if 'cmap' in kwargs:
pp.set_cmap(kwargs.pop('cmap'))
if 'cMap' in kwargs:
pp.set_cmap(kwargs.pop('cMap'))
pp.set_norm(norm)
pp.set_array(np.array(vals))
pp.set_clim(cMin, cMax)
xval = [k for k in xmap.keys()]
ax.set_xlim(min(xval) - dx / 2, max(xval) + dx / 2)
ax.set_ylim(len(ymap) + 0.5, -0.5)
updateAxes_(ax)
cbar = None
if kwargs.pop('colorBar', True):
ori = kwargs.pop('orientation', 'horizontal')
cbar = pg.mplviewer.createColorBar(col, cMin=cMin, cMax=cMax, nLevs=5,
label=label, orientation=ori)
return ax, cbar
[docs]def plotMatrix(mat, xmap=None, ymap=None, ax=None, cMin=None, cMax=None,
logScale=None, label=None, **kwargs):
"""Plot previously generated (generateVecMatrix) matrix.
Parameters
----------
mat : numpy.array2d
matrix to show
xmap : dict {i:num}
dict (must match A.shape[0])
ymap : iterable
vector for x axis (must match A.shape[0])
ax : mpl.axis
axis to plot, if not given a new figure is created
cMin/cMax : float
minimum/maximum color values
logScale : bool
logarithmic colour scale [min(A)>0]
label : string
colorbar label
Returns
-------
ax : matplotlib axes object
axes object
cb : matplotlib colorbar
colorbar object
"""
if xmap is None:
xmap = {i: i for i in range(mat.shape[0])}
if ymap is None:
ymap = {i: i for i in range(mat.shape[1])}
if isinstance(mat, np.ma.MaskedArray):
mat_ = mat
else:
mat_ = np.ma.masked_where(mat == 0.0, mat, False)
if cMin is None:
cMin = np.min(mat_)
if cMax is None:
cMax = np.max(mat_)
if logScale is None:
logScale = (cMin > 0.0)
if logScale:
norm = LogNorm(vmin=cMin, vmax=cMax)
else:
norm = Normalize(vmin=cMin, vmax=cMax)
if ax is None:
ax = plt.subplots()[1]
im = ax.imshow(mat_, norm=norm, interpolation='nearest')
if 'cmap' in kwargs:
im.set_cmap(kwargs.pop('cmap'))
if 'cMap' in kwargs:
im.set_cmap(kwargs.pop('cMap'))
ax.set_aspect(kwargs.pop('aspect', 1))
cbar = None
if kwargs.pop('colorBar', True):
ori = kwargs.pop('orientation', 'horizontal')
cbar = pg.mplviewer.createColorBar(im, cMin=cMin, cMax=cMax, nLevs=5,
label=label, orientation=ori)
ax.grid(True)
xt = np.unique(ax.get_xticks().clip(0, len(xmap) - 1))
yt = np.unique(ax.get_xticks().clip(0, len(ymap) - 1))
if kwargs.pop('showally', False):
yt = np.arange(len(ymap))
else:
yt = np.round(np.linspace(0, len(ymap) - 1, 5))
xx = np.sort([k for k in xmap])
ax.set_xticks(xt)
ax.set_xticklabels(['{:g}'.format(round(xx[int(ti)], 2)) for ti in xt])
yy = np.unique([k for k in ymap])
ax.set_yticks(yt)
ax.set_yticklabels(['{:g}'.format(round(yy[int(ti)], 2)) for ti in yt])
return ax, cbar
[docs]def plotVecMatrix(xvec, yvec, vals, full=False, **kwargs):
"""DEPRECATED for nameing."""
pg.deprecated('plotVecMatrix', 'showVecMatrix')
return showVecMatrix(xvec, yvec, vals, full, **kwargs)
[docs]def showVecMatrix(xvec, yvec, vals, full=False, **kwargs):
"""Plot three vectors as matrix.
Parameters
----------
xvec, yvec : iterable (e.g. list, np.array, pg.RVector) of identical length
vectors defining the indices into the matrix
vals : iterable of same length as xvec/yvec
vector containing the values to show
full: bool [False]
use a fully symmetric matrix containing all unique xvec+yvec
otherwise A is squeezed to the individual unique xvec/yvec values
**kwargs: forwarded to plotMatrix
* ax : mpl.axis
Axis to plot, if not given a new figure is created
* cMin/cMax : float
Minimum/maximum color values
* logScale : bool
Lgarithmic colour scale [min(A)>0]
* label : string
Colorbar label
Returns
-------
ax : matplotlib axes object
axes object
cb : matplotlib colorbar
colorbar object
"""
A, xmap, ymap = generateMatrix(xvec, yvec, vals, full=full)
kwargs.setdefault('xmap', xmap)
kwargs.setdefault('ymap', ymap)
return plotMatrix(A, **kwargs)
[docs]def plotDataContainerAsMatrix(*args, **kwargs):
"DEPRECATED naming scheme"""
pg.deprecated('plotDataContainerAsMatrix', 'showDataContainerAsMatrix')
return showDataContainerAsMatrix(*args, **kwargs)
[docs]def showDataContainerAsMatrix(data, x=None, y=None, v=None, **kwargs):
"""Plot data container as matrix (cross-plot).
for each x, y and v token strings or vectors should be given
"""
mul = kwargs.pop('mul', 10**int(np.ceil(np.log10(data.sensorCount()))))
plus = kwargs.pop('plus', 1) # add 1 to count
verbose = kwargs.pop('verbose', False)
if hasattr(x, '__iter__') and isinstance(x[0], str):
num = np.zeros(data.size())
for token in x:
num *= mul
num += data(token) + plus
x = num.copy()
# kwargs.setdefault('xmap', {n: i for i, n in enumerate(np.unique(x))})
# xmap = {}
# for i, n in enumerate(np.unique(x)):
# st = ''
# while n > 0:
# st = str(n % mul) + '-' + st
# n = n // mul
# xmap[]
elif isinstance(x, str):
x = data(x)
if hasattr(y, '__iter__') and isinstance(y[0], str):
num = np.zeros(data.size())
for token in y:
num *= mul
num += data(token) + plus
y = num.copy()
# kwargs.setdefault('ymap', {n: i for i, n in enumerate(np.unique(y))})
elif isinstance(y, str):
y = data(y)
if isinstance(v, str):
v = data(v)
if verbose:
pg.info("x vector length: {:d}".format(len(x)))
pg.info("y vector length: {:d}".format(len(y)))
pg.info("v vector length: {:d}".format(len(v)))
if x is None or y is None or v is None:
raise Exception("Vectors or strings must be given")
if len(x) != len(y) or len(x) != len(v):
raise Exception("lengths x/y/v not matching: {:d}!={:d}!={:d}".format(
len(x), len(y), len(v)))
return showVecMatrix(x, y, v, **kwargs)
[docs]def drawSensorAsMarker(ax, data):
"""Draw Sensor marker, these marker are pickable."""
elecsX = []
elecsY = []
for i in range(len(data.sensorPositions())):
elecsX.append(data.sensorPositions()[i][0])
elecsY.append(data.sensorPositions()[i][1])
electrodeMarker, = ax.plot(elecsX, elecsY, 'x', color='black', picker=5.)
ax.set_xlim([data.sensorPositions()[0][0] - 1.,
data.sensorPositions()[data.sensorCount() - 1][0] + 1.])
return electrodeMarker