Ctrl+K
Logo image Logo image

pyGIMLi

Site Navigation

  • Home
  • Documentation
  • API Reference
  • Installation
  • Tutorials
  • Examples

Site Navigation

  • Home
  • Documentation
  • API Reference
  • Installation
  • Tutorials
  • Examples

Section Navigation

  • Mesh generation
    • Meshing the Omega aka. BERT logo
    • CAD to mesh tutorial
    • Extrude a 2D mesh to 3D
    • Flexible mesh generation using Gmsh
    • Building a hybrid mesh in 2D
  • Seismic refraction and traveltime tomography
    • 2D Refraction modeling and inversion
    • Crosshole traveltime tomography
    • Raypaths in layered and gradient models
    • Field data inversion (“Koenigsee”)
    • Refraction in 3D
  • Electrical resistivity tomography
    • 2D ERT modeling and inversion
    • ERT field data with topography
    • 2D FEM modelling on two-layer example
    • Geoelectrics in 2.5D
    • Four-point sensitivities
    • 3D modeling in a closed geometry
  • Induced polarization
    • Generating SIP signatures
    • Fitting SIP signatures
    • Complex-valued electrical modeling
    • Naive complex-valued electrical inversion
  • Gravimetry and magnetics
    • Gravimetry in 2D - Part I
    • Semianalytical Gravimetry and Geomagnetics in 2D
    • 3D magnetics modelling and inversion
  • Miscellaneous
    • 3D Darcy flow
    • Hydrogeophysical modeling
  • Inversion
    • DC-EM Joint inversion
    • Petrophysical joint inversion
    • Incorporating prior data into ERT inversion

Note

Click here to download the full example code

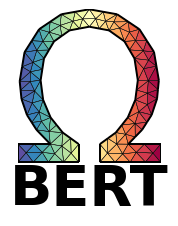
Meshing the Omega aka. BERT logo#

This is a fun example creating a logo for the BERT software. It illustrates the possibility to hand over matplotlib path objects to the TriangleWrapper.

import matplotlib as mpl
import matplotlib.pyplot as plt

import pygimli as pg

We start by generating a matplotlib path respresenting the \(\Omega\) character.

logo_path = mpl.textpath.TextPath((0, 0), r'$\Omega$', size=5)
patch = mpl.patches.PathPatch(logo_path)

The vertices of the path are defined as mesh nodes and connected with edges.

poly = pg.Mesh(2)

for n in patch.get_verts() * 10:
    poly.createNodeWithCheck(n)

for i in range(poly.nodeCount() - 1):
    poly.createEdge(poly.node(i), poly.node(i + 1))

poly.createEdge(poly.node(poly.nodeCount() - 1), poly.node(0))
<pygimli.core._pygimli_.Edge object at 0x7fe8eaa7ea60>

We create mesh from the polygone and set the x values as the data for a color transition.

mesh = pg.meshtools.createMesh(poly, area=5)

Last, we create a BERT caption, visualize the mesh and fine-tune the figure.

fig, ax = plt.subplots(figsize=(4, 3))
ax.axis('off')
offset = -10
t = ax.text(mesh.xmin() + (mesh.xmax()-mesh.xmin())/2, offset, 'BERT',
            horizontalalignment='center', size=40, fontweight='bold')
pg.show(mesh, pg.x(mesh.cellCenters()), ax=ax, cMap='Spectral_r',
        logScale=False, showLater=True, showMesh=True, colorBar=False)
ax.set_ylim(offset, mesh.ymax())
plot bert logo
(-10, 37.0)

Download Python source code: plot_bert-logo.py

Download Jupyter notebook: plot_bert-logo.ipynb

Gallery generated by Sphinx-Gallery

previous

Mesh generation

next

CAD to mesh tutorial

Improve this page
2022 - pyGIMLi Development Team
Created using Sphinx with the PyData theme and pyGIMLi 1.3.1+2.g7599abf9 on Dec 09, 2022.