# -*- coding: utf-8 -*-
"""Draw mesh/model/fields with matplotlib."""
import textwrap
import matplotlib as mpl
import matplotlib.pyplot as plt
import numpy as np
import pygimli as pg
from pygimli.misc import streamline
from .colorbar import autolevel, createColorBar, updateColorBar
from .utils import updateAxes as updateAxes_
class CellBrowserCacheSingleton(object):
__instance = None
cbCache_ = []
def __new__(cls):
if CellBrowserCacheSingleton.__instance is None:
CellBrowserCacheSingleton.__instance = object.__new__(cls)
return CellBrowserCacheSingleton.__instance
def add(self, c):
self.cbCache_.append(c)
def remove(self, c):
self.cbCache_.remove(c)
# We only want one instance of this global cache so its a singleton class
__CBCache__ = CellBrowserCacheSingleton()
[docs]class CellBrowser(object):
"""Interactive cell browser on current or specified ax for a given mesh.
Cell information can be displayed by mouse picking. Arrow keys up and down
can be used to scroll through the cells, while ESC closes the cell
information window.
Parameters
----------
mesh : 2D pygimli.Mesh instance
The plotted mesh to browse through.
data : iterable
Cell data.
ax : mpl axis instance, optional
Axis instance where the mesh is plotted (default is current axis).
Examples
--------
>>> import matplotlib.pyplot as plt
>>> import pygimli as pg
>>> from pygimli.mplviewer import drawModel
>>> from pygimli.mplviewer import CellBrowser
>>>
>>> mesh = pg.createGrid(range(5), range(5))
>>> fig, ax = plt.subplots()
>>> plc = drawModel(ax, mesh, mesh.cellMarkers())
>>> browser = CellBrowser(mesh)
>>> browser.connect()
"""
[docs] def __init__(self, mesh, data=None, ax=None):
"""Construct CellBrowser on a specific `mesh`."""
if ax:
self.ax = ax
else:
self.ax = mpl.pyplot.gca()
self._connected = False
self.fig = self.ax.figure
self.mesh = None
self.data = None
self.highLight = None
self.text = None
self.cellID = None
self.event = None
self.artist = None
self.pid = None
self.kid = None
self.text = None
self.setMesh(mesh)
self.setData(data)
self.connect()
def __del__(self):
"""Deregister if the cellBrowser has been deleted."""
self.disconnect()
[docs] def connect(self):
"""Connect to matplotlib figure canvas."""
if not self._connected:
self.pid = self.fig.canvas.mpl_connect('pick_event', self.onPick)
self.kid = self.fig.canvas.mpl_connect('key_press_event',
self.onPress)
__CBCache__.add(self)
self._connected = True
[docs] def disconnect(self):
"""Disconnect from matplotlib figure canvas."""
if self._connected:
__CBCache__.remove(self)
self.fig.canvas.mpl_disconnect(self.pid)
self.fig.canvas.mpl_disconnect(self.kid)
self._connected = False
[docs] def initText(self):
bbox = dict(boxstyle='round, pad=0.5', fc='w', alpha=0.5)
arrowprops = dict(arrowstyle='->', connectionstyle='arc3,rad=0.5')
kwargs = dict(fontproperties='monospace', visible=False,
fontsize=mpl.rcParams['font.size'] - 2, weight='bold',
xytext=(50, 20), arrowprops=arrowprops,
textcoords='offset points', bbox=bbox, va='center')
self.text = self.ax.annotate(None, xy=(0, 0), **kwargs)
[docs] def setMesh(self, mesh):
self.mesh = mesh
[docs] def setData(self, data=None):
"""Set data, if not set look for the artist array data."""
self.hide()
if data is not None:
if len(data) == self.mesh.cellCount():
self.data = data
elif len(data) == self.mesh.nodeCount():
self.data = pg.meshtools.nodeDataToCellData(self.mesh, data)
else:
pg.warn('Data length mismatch mesh.cellCount(): ' +
str(len(data)) + "!=" + str(self.mesh.cellCount()) +
". Mapping data to cellMarkers().")
self.data = data[self.mesh.cellMarkers()]
[docs] def hide(self):
"""Hide info window."""
self.cellID = -1
if self.text is not None:
self.text.set_visible(False)
self.removeHighlightCell()
self.fig.canvas.draw()
[docs] def removeHighlightCell(self):
"""Remove cell highlights."""
if self.highLight is not None:
if self.highLight in self.ax.collections:
self.highLight.remove()
self.highLight = None
[docs] def highlightCell(self, cell):
"""Highlight selected cell."""
self.removeHighlightCell()
self.highLight = mpl.collections.PolyCollection(
[_createCellPolygon(cell)])
self.highLight.set_edgecolors('0')
self.highLight.set_linewidths(1.5)
self.highLight.set_facecolors([0.9, 0.9, 0.9, 0.4])
self.ax.add_collection(self.highLight)
[docs] def onPick(self, event):
"""Call `self.update()` on mouse pick event."""
self.event = event
self.artist = event.artist
if self.data is None:
self.data = self.artist.get_array()
# self.edgeColors = self.artist.get_edgecolors()
if 'mouseevent' in event.__dict__.keys():
# print(event.__dict__.keys())
# print(event.mouseevent)
if (event.mouseevent.xdata is not None and
event.mouseevent.ydata is not None and
event.mouseevent.button == 1):
c = self.mesh.findCell((event.mouseevent.xdata,
event.mouseevent.ydata))
if c and self.cellID != c.id():
self.cellID = c.id()
else:
self.cellID = -1
self.update()
else: # variant before (seemed inaccurate)
self.cellID = event.ind[0]
[docs] def onPress(self, event):
"""Call `self.update()` if up, down, or escape keys are pressed."""
# print(event, event.key)
if self.data is None:
return
if event.key not in ('up', 'down', 'escape'):
return
if event.key is 'up':
if self.cellID is not None:
self.cellID += 1
elif event.key is 'down':
if self.cellID is not None:
self.cellID -= 1
else:
self.hide()
return
if self.cellID is not None:
self.cellID = int(np.clip(self.cellID, 0,
self.mesh.cellCount() - 1))
self.update()
[docs] def update(self):
"""Update the information window.
Hide the information window for self.cellID == -1
"""
try:
if self.cellID > -1:
cell = self.mesh.cell(self.cellID)
center = cell.center()
x, y = center.x(), center.y()
marker = cell.marker()
data = self.data[self.cellID]
header = "Cell %d:\n" % self.cellID
header += "-" * (len(header) - 1)
istr = "\nx: {:.2f}\n y: {:.2f}\n data: {:.2e}\n marker: {:d}"
info = istr.format(x, y, data, marker)
text = header + textwrap.dedent(info)
if self.text is None or self.text not in self.ax.texts:
self.initText()
self.text.set_text(text)
self.text.xy = x, y
self.text.set_visible(True)
self.highlightCell(cell)
self.fig.canvas.draw()
else:
self.hide()
except BaseException as e:
print(e)
[docs]def drawMesh(ax, mesh, **kwargs):
"""Draw a 2d mesh into a given ax.
Set the limits of the ax tor the mesh extent.
Parameters
----------
mesh : :gimliapi:`GIMLI::Mesh`
The plotted mesh to browse through.
ax : mpl axe instance, optional
Axis instance where the mesh is plotted (default is current axis).
fitView: bool [True]
Adjust ax limits to mesh bounding box.
Examples
--------
>>> import numpy as np
>>> import matplotlib.pyplot as plt
>>> import pygimli as pg
>>> from pygimli.mplviewer import drawMesh
>>> n = np.linspace(1, 2, 10)
>>> mesh = pg.createGrid(x=n, y=n)
>>> fig, ax = plt.subplots()
>>> drawMesh(ax, mesh)
>>> plt.show()
"""
if mesh.cellCount() == 0:
pg.mplviewer.drawPLC(ax, mesh, **kwargs)
else:
pg.mplviewer.drawMeshBoundaries(ax, mesh, **kwargs)
if kwargs.pop('fitView', True):
ax.set_xlim(mesh.xmin(), mesh.xmax())
ax.set_ylim(mesh.ymin(), mesh.ymax())
ax.set_aspect('equal')
updateAxes_(ax)
[docs]def drawModel(ax, mesh, data=None, logScale=True, cMin=None, cMax=None,
xlabel=None, ylabel=None, verbose=False,
tri=False, rasterized=False, **kwargs):
"""Draw a 2d mesh and color the cell by the data.
Parameters
----------
mesh : :gimliapi:`GIMLI::Mesh`
The plotted mesh to browse through.
ax : mpl axis instance, optional
Axis instance where the mesh is plotted (default is current axis).
data : array, optional
Data to draw. Should either equal numbers of cells or nodes of the
corresponding `mesh`.
tri : boolean, optional
use MPL tripcolor (experimental)
rasterized : boolean, optional
Rasterize mesh patches to reduce file size and avoid zooming artifacts
in some PDF viewers.
**kwargs : Additional keyword arguments
Will be forwarded to the draw functions and matplotlib methods,
respectively.
Returns
-------
gci : matplotlib graphics object
Examples
--------
>>> import numpy as np
>>> import matplotlib.pyplot as plt
>>> import pygimli as pg
>>> from pygimli.mplviewer import drawModel
>>> n = np.linspace(0, -2, 11)
>>> mesh = pg.createGrid(x=n, y=n)
>>> mx = pg.x(mesh.cellCenter())
>>> my = pg.y(mesh.cellCenter())
>>> data = np.cos(1.5 * mx) * np.sin(1.5 * my)
>>> fig, ax = plt.subplots()
>>> drawModel(ax, mesh, data)
<matplotlib.collections.PolyCollection object at ...>
"""
# deprecated .. remove me
if 'cMap' in kwargs or 'cmap' in kwargs:
pg.warn('cMap|cmap argument is deprecated for draw functions. ' +
'Please use show or customize a colorbar.')
# deprecated .. remove me
if mesh.nodeCount() == 0:
pg.error("drawModel: The mesh is empty.", mesh)
if tri:
gci = drawMPLTri(ax, mesh, data,
cMin=cMin, cMax=cMax, logScale=logScale,
**kwargs)
else:
gci = pg.mplviewer.createMeshPatches(ax, mesh, verbose=verbose,
rasterized=rasterized)
ax.add_collection(gci)
if data is None:
data = pg.RVector(mesh.cellCount())
if len(data) != mesh.cellCount():
print(data, mesh)
pg.info("drawModel have wrong data length .. " +
" indexing data from cellMarkers()")
viewdata = data[mesh.cellMarkers()]
else:
viewdata = data
if min(data) <= 0:
logScale = False
pg.mplviewer.setMappableData(gci, viewdata, cMin=cMin, cMax=cMax,
logScale=logScale)
gci.set_antialiased(True)
gci.set_linewidths(0.1)
gci.set_edgecolors("face")
if xlabel is not None:
ax.set_xlabel(xlabel)
if ylabel is not None:
ax.set_ylabel(ylabel)
if kwargs.pop('fitView', True):
ax.set_xlim(mesh.xmin(), mesh.xmax())
ax.set_ylim(mesh.ymin(), mesh.ymax())
ax.set_aspect('equal')
updateAxes_(ax)
return gci
[docs]def drawSelectedMeshBoundaries(ax, boundaries, color=None, linewidth=1.0,
linestyles="-"):
"""Draw mesh boundaries into a given axes.
Parameters
----------
ax : matplotlib axes
axes to plot into
boundaries : :gimliapi:`GIMLI::Mesh` boundary vector
collection of boundaries to plot
color : matplotlib color |str [None]
matching color or string, else colors are according to markers
linewidth : float [1.0]
line width
linestyles : linestyle for line collection, i.e. solid or dashed
Returns
-------
lco : matplotlib line collection object
"""
drawAA = True
lines = []
if hasattr(boundaries, '__len__'):
if len(boundaries) == 0:
return
for bound in boundaries:
lines.append(list(zip([bound.node(0).x(), bound.node(1).x()],
[bound.node(0).y(), bound.node(1).y()])))
lineCollection = mpl.collections.LineCollection(lines, antialiaseds=drawAA)
if color is None:
viewdata = [b.marker() for b in boundaries]
pg.mplviewer.setMappableData(lineCollection, viewdata, logScale=False)
else:
lineCollection.set_color(color)
lineCollection.set_linewidth(linewidth)
lineCollection.set_linestyles(linestyles)
ax.add_collection(lineCollection)
updateAxes_(ax)
return lineCollection
[docs]def drawSelectedMeshBoundariesShadow(ax, boundaries, first='x', second='y',
color=(0.3, 0.3, 0.3, 1.0)):
"""Draw mesh boundaries as shadows into a given axes.
Parameters
----------
ax : matplotlib axes
axes to plot into
boundaries : :gimliapi:`GIMLI::Mesh` boundary vector
collection of boundaries to plot
first / second : str ['x' / 'y']
attribute names to retrieve from nodes
color : matplotlib color |str [None]
matching color or string, else colors are according to markers
linewidth : float [1.0]
line width
Returns
-------
lco : matplotlib line collection object
"""
polys = []
for cell in boundaries:
polys.append(list(zip([getattr(cell.node(0), first)(),
getattr(cell.node(1), first)(),
getattr(cell.node(2), first)()],
[getattr(cell.node(0), second)(),
getattr(cell.node(1), second)(),
getattr(cell.node(2), second)()])))
collection = mpl.collections.PolyCollection(polys, antialiaseds=True)
collection.set_color(color)
collection.set_edgecolor(color)
collection.set_linewidth(0.2)
ax.add_collection(collection)
updateAxes_(ax)
return collection
[docs]def drawMeshBoundaries(ax, mesh, hideMesh=False, useColorMap=False, **kwargs):
"""Draw mesh on ax with boundary conditions colorized.
Parameters
----------
hideMesh: bool [False]
Show only the boundary of the mesh and omit inner edges that
separate the cells.
useColorMap: bool[False]
Apply the default colormap to boundaries with marker values > 0
**kwargs:
* fitView : bool [True]
* linewidth : float [0.3]
linewidth for edges with marker == 0 if hideMesh is False.
Examples
--------
>>> import numpy as np
>>> import matplotlib.pyplot as plt
>>> import pygimli as pg
>>> from pygimli.mplviewer import drawMeshBoundaries
>>> n = np.linspace(0, -2, 11)
>>> mesh = pg.createGrid(x=n, y=n)
>>> for bound in mesh.boundaries():
... if not bound.rightCell():
... bound.setMarker(pg.MARKER_BOUND_MIXED)
... if bound.center().y() == 0:
... bound.setMarker(pg.MARKER_BOUND_HOMOGEN_NEUMANN)
>>> fig, ax = plt.subplots()
>>> drawMeshBoundaries(ax, mesh)
"""
if not mesh:
raise Exception("drawMeshBoundaries(ax, mesh): invalid mesh")
if not mesh.dimension() == 2:
raise Exception("No 2d mesh: dim = ", mesh.dimension())
if mesh.nodeCount() < 2:
raise Exception("drawMeshBoundaries(ax, mesh): to few nodes",
mesh.nodeCount())
if kwargs.pop('fitView', True):
ax.set_xlim(mesh.xmin() - 0.05, mesh.xmax() + 0.05)
ax.set_ylim(mesh.ymin() - 0.05, mesh.ymax() + 0.05)
# drawAA = True
# swatch = pg.Stopwatch(True)
mesh.createNeighbourInfos()
lw = kwargs.pop('lw', None)
col = kwargs.pop('color', None)
if not hideMesh:
drawSelectedMeshBoundaries(ax,
mesh.findBoundaryByMarker(0),
color=(0.0, 0.0, 0.0, 1.0),
linewidth=lw or 0.3)
drawSelectedMeshBoundaries(
ax, mesh.findBoundaryByMarker(pg.MARKER_BOUND_HOMOGEN_NEUMANN),
color=(0.0, 1.0, 0.0, 1.0),
linewidth=lw or 1.0)
drawSelectedMeshBoundaries(
ax, mesh.findBoundaryByMarker(pg.MARKER_BOUND_MIXED),
color=(1.0, 0.0, 0.0, 1.0),
linewidth=lw or 1.0)
b0 = [b for b in mesh.boundaries() if b.marker() > 0]
if useColorMap:
drawSelectedMeshBoundaries(ax, b0, color=None,
linewidth=lw or 1.5)
else:
drawSelectedMeshBoundaries(ax, b0,
color=col or (0.0, 0.0, 0.0, 1.0),
linewidth=lw or 1.5)
b4 = [b for b in mesh.boundaries() if b.marker() < -4]
drawSelectedMeshBoundaries(ax, b4,
color=col or (0.0, 0.0, 0.0, 1.0),
linewidth=lw or 1.5)
updateAxes_(ax)
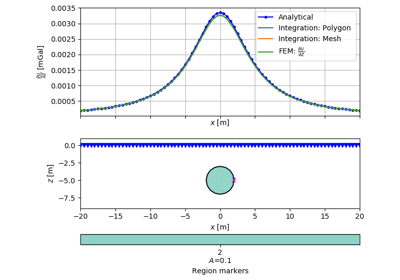
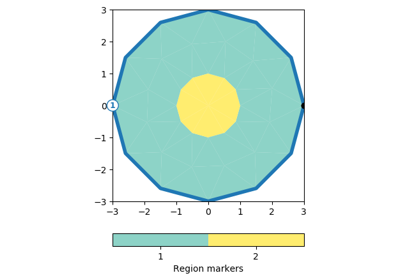
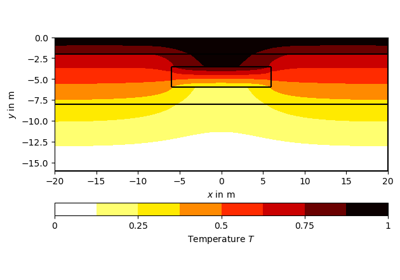
[docs]def drawPLC(ax, mesh, fillRegion=True, regionMarker=True, boundaryMarker=False,
showNodes=False, **kwargs):
"""Draw 2D PLC into given axes.
Parameters
----------
fillRegion: bool [True]
Fill the regions with default colormap.
regionMarker: bool [True]
show region marker
boundaryMarker: bool [False]
show boundary marker
showNodes: bool [False]
draw all nodes
**kwargs
Examples
--------
>>> import matplotlib.pyplot as plt
>>> import pygimli as pg
>>> import pygimli.meshtools as mt
>>> # Create geometry definition for the modeling domain
>>> world = mt.createWorld(start=[-20, 0], end=[20, -16],
... layers=[-2, -8], worldMarker=False)
>>> # Create a heterogeneous block
>>> block = mt.createRectangle(start=[-6, -3.5], end=[6, -6.0],
... marker=10, boundaryMarker=10, area=0.1)
>>> fig, ax = plt.subplots()
>>> geom = mt.mergePLC([world, block])
>>> pg.mplviewer.drawPLC(ax, geom)
"""
# eCircles = []
if fillRegion and mesh.boundaryCount() > 2:
tmpMesh = pg.meshtools.createMesh(mesh, quality=20, area=0)
if tmpMesh.cellCount() == 0:
pass
else:
markers = np.array(tmpMesh.cellMarkers())
uniquemarkers, uniqueidx = np.unique(markers, return_inverse=True)
gci = drawModel(ax=ax,
data=np.arange(len(uniquemarkers))[uniqueidx],
mesh=tmpMesh,
alpha=1,
linewidth=0.0,
tri=True,
snap=True,
)
if regionMarker:
cbar = createColorBar(gci, label="Region markers")
updateColorBar(
cbar, cMap=plt.cm.get_cmap("Set3", len(uniquemarkers)),
cMin=-0.5, cMax=len(uniquemarkers) - 0.5)
ticks = np.arange(len(uniquemarkers))
cbar.set_ticks(ticks)
areas = {}
for reg in mesh.regionMarker():
areas[reg.marker()] = reg.area()
labels = []
for marker in uniquemarkers:
label = "{:d}".format(marker)
if marker in areas and areas[marker] > 0:
label += "\n$A$={:g}".format(areas[marker])
# label += "\n(area: %s)" % areas[marker]
labels.append(label)
cbar.set_ticklabels(labels)
else:
if kwargs.pop('showBoundary', True):
drawMeshBoundaries(ax, mesh, **kwargs)
if showNodes:
for n in mesh.nodes():
col = (0.0, 0.0, 0.0, 0.5)
if n.marker() == pg.MARKER_NODE_SENSOR:
col = (0.0, 0.0, 0.0, 1.0)
# ms = kwargs.pop('markersize', 5)
ax.plot(n.pos()[0], n.pos()[1], 'bo', color=col, **kwargs)
# eCircles.append(mpl.patches.Circle((n.pos()[0], n.pos()[1])))
# eCircles.append(mpl.patches.Circle((n.pos()[0], n.pos()[1]), 0.1))
# cols.append(col)
# p = mpl.collections.PatchCollection(eCircles, color=cols)
# ax.add_collection(p)
if boundaryMarker:
for b in mesh.boundaries():
x = b.center()[0]
y = b.center()[1]
bbox_props = dict(boxstyle="circle,pad=0.1", fc="w", ec="k")
ax.text(x, y, str(b.marker()), color="k", va="center", ha="center",
zorder=20, bbox=bbox_props, fontsize=9)
if regionMarker:
for hole in mesh.holeMarker():
ax.text(hole[0], hole[1], 'H', color='black',
va="center", ha="center")
if kwargs.pop('fitView', True):
ax.set_xlim(mesh.xmin(), mesh.xmax())
ax.set_ylim(mesh.ymin(), mesh.ymax())
ax.set_aspect('equal')
updateAxes_(ax)
def _createCellPolygon(cell):
"""Utility function to polygon for cell shape to be used by MPL."""
if cell.shape().nodeCount() == 3:
return list(zip([cell.node(0).x(), cell.node(1).x(),
cell.node(2).x()],
[cell.node(0).y(), cell.node(1).y(),
cell.node(2).y()]))
elif cell.shape().nodeCount() == 4:
return list(zip([cell.node(0).x(), cell.node(1).x(),
cell.node(2).x(), cell.node(3).x()],
[cell.node(0).y(), cell.node(1).y(),
cell.node(2).y(), cell.node(3).y()]))
pg.warn("Unknown shape to patch: ", cell)
[docs]def createMeshPatches(ax, mesh, verbose=True, rasterized=False):
"""Utility function to create 2d mesh patches within a given ax."""
if not mesh:
pg.error("drawMeshBoundaries(ax, mesh): invalid mesh:", mesh)
return
if mesh.nodeCount() < 2:
pg.error("drawMeshBoundaries(ax, mesh): to few nodes:", mesh)
return
pg.tic()
polys = [_createCellPolygon(c) for c in mesh.cells()]
patches = mpl.collections.PolyCollection(polys, picker=True,
rasterized=rasterized)
if verbose:
pg.info("Creation of mesh patches took = ", pg.toc())
return patches
[docs]def createTriangles(mesh, data=None):
"""Generate triangle objects for later drawing.
Parameters
----------
mesh : :gimliapi:`GIMLI::Mesh`
pyGimli mesh to plot
data : iterable [None]
cell-based values to plot
Returns
-------
x : numpy array
x position of nodes
y : numpy array
x position of nodes
triangles : numpy array Cx3
cell indices for each triangle
z : numpy array
data for given indices
dataIdx : list of int
list of indices into array to plot
"""
x = pg.x(mesh.positions())
# x.round(1e-1)
y = pg.y(mesh.positions())
# y.round(1e-1)
triCount = 0
for c in mesh.cells():
if c.shape().nodeCount() == 4:
triCount = triCount + 2
else:
triCount = triCount + 1
triangles = np.zeros((triCount, 3))
dataIdx = list(range(triCount))
triCount = 0
for c in mesh.cells():
if c.shape().nodeCount() == 4:
triangles[triCount, 0] = c.node(0).id()
triangles[triCount, 1] = c.node(1).id()
triangles[triCount, 2] = c.node(2).id()
dataIdx[triCount] = c.id()
triCount = triCount + 1
triangles[triCount, 0] = c.node(0).id()
triangles[triCount, 1] = c.node(2).id()
triangles[triCount, 2] = c.node(3).id()
dataIdx[triCount] = c.id()
triCount = triCount + 1
else:
triangles[triCount, 0] = c.node(0).id()
triangles[triCount, 1] = c.node(1).id()
triangles[triCount, 2] = c.node(2).id()
dataIdx[triCount] = c.id()
triCount = triCount + 1
z = None
if data is not None:
if len(data) == mesh.cellCount():
# strange behavior if we just use these slice
z = np.array(data[dataIdx])
else:
z = np.array(data)
return x, y, triangles, z, dataIdx
[docs]def drawMPLTri(ax, mesh, data=None,
cMin=None, cMax=None, logScale=True,
**kwargs):
"""Draw mesh based scalar field using matplotlib triplot.
Draw scalar field into MPL axes using matplotlib triplot.
TODO
* Examples
* Doc: Interpolation variants
Parameters
----------
data: iterable
Scalar field values. Can be of length mesh.cellCount()
or mesh.nodeCount().
**kwargs:
* shading: interpolation algorithm [flat]
* fillContour: [True]
* withContourLines: [True]
Returns
-------
gci : image object
The current image object useful for post color scaling
Examples
--------
>>>
"""
# deprecated remove me
if 'cMap' in kwargs or 'cmap' in kwargs:
pg.warn('cMap|cmap argument is deprecated for draw functions.' +
'Please use show or customize a colorbar.')
# deprecated remove me
x, y, triangles, z, _ = createTriangles(mesh, data)
gci = None
levels = kwargs.pop('levels', [])
nLevs = kwargs.pop('nLevs', 5)
if len(levels) == 0:
levels = autolevel(data, nLevs, zmin=cMin, zmax=cMax,
logScale=logScale)
if len(z) == len(triangles):
shading = kwargs.pop('shading', 'flat')
# bounds = np.linspace(levels[0], levels[-1], nLevs)
# norm = colors.BoundaryNorm(boundaries=bounds, ncolors=256)
if shading == 'gouraud':
z = pg.meshtools.cellDataToNodeData(mesh, data)
gci = ax.tripcolor(x, y, triangles, z,
shading=shading, **kwargs)
else:
gci = ax.tripcolor(x, y, triangles, facecolors=z,
shading=shading, **kwargs)
elif len(z) == mesh.nodeCount():
shading = kwargs.pop('shading', None)
if shading is not None:
gci = ax.tripcolor(x, y, triangles, z, shading=shading, **kwargs)
else:
fillContour = kwargs.pop('fillContour', True)
contourLines = kwargs.pop('withContourLines', True)
if fillContour:
# add outer climits to fill lower and upper too
levs = np.array(levels)
if min(z) < min(levels):
levs = np.hstack([min(z), levs])
if max(z) > max(levels):
levs = np.hstack([levs, max(z)])
gci = ax.tricontourf(x, y, triangles, z, levels=levs,
**kwargs)
if contourLines:
ax.tricontour(x, y, triangles, z, levels=levels,
colors=kwargs.pop('colors', ['0.5']), **kwargs)
else:
gci = None
raise Exception("Data size does not fit mesh size: ", len(z),
mesh.cellCount(), mesh.nodeCount())
if gci and cMin and cMax:
gci.set_clim(cMin, cMax)
if kwargs.pop('fitView', True):
ax.set_xlim(mesh.xmin(), mesh.xmax())
ax.set_ylim(mesh.ymin(), mesh.ymax())
ax.set_aspect('equal')
updateAxes_(ax)
return gci
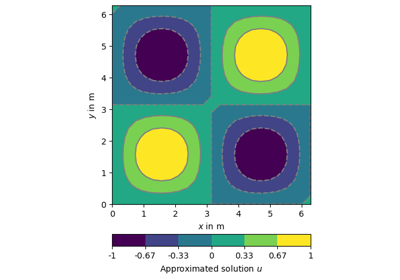
[docs]def drawField(ax, mesh, data=None, **kwargs):
"""Draw a mesh-related (node or cell based) field onto a given MPL axis.
Only for triangle/quadrangle meshes currently
Parameters
----------
ax : MPL axes
mesh : :gimliapi:`GIMLI::Mesh`
data: iterable
Scalar field values. Can be of length mesh.cellCount()
or mesh.nodeCount().
**kwargs:
* shading: interpolation algorithm [flat]
* fillContour: [True]
* withContourLines: [True]
Returns
-------
gci : image object
The current image object useful for post color scaling
Examples
--------
>>> import numpy as np
>>> import matplotlib.pyplot as plt
>>> import pygimli as pg
>>> from pygimli.mplviewer import drawField
>>> n = np.linspace(0, -2, 11)
>>> mesh = pg.createGrid(x=n, y=n)
>>> nx = pg.x(mesh.positions())
>>> ny = pg.y(mesh.positions())
>>> data = np.cos(1.5 * nx) * np.sin(1.5 * ny)
>>> fig, ax = plt.subplots()
>>> drawField(ax, mesh, data)
<matplotlib.tri.tricontour.TriContourSet ...>
"""
return drawMPLTri(ax, mesh, data, **kwargs)
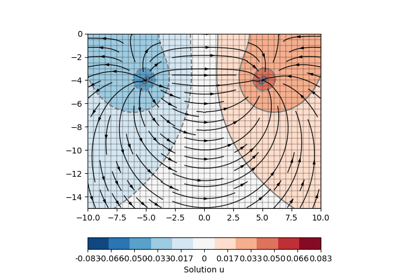
[docs]def drawStreamLines(ax, mesh, u, nx=25, ny=25, **kwargs):
"""Draw streamlines for the gradients of field values u on a mesh.
The matplotlib routine streamplot needs equidistant spacings so
we interpolate first on a grid defined by nx and ny nodes.
Additionally arguments are piped to streamplot.
This works only for rectangular regions.
You should use pg.mplviewer.drawStreams, which is more comfortable and
more flexible.
"""
X, Y = np.meshgrid(
np.linspace(mesh.xmin(), mesh.xmax(), nx),
np.linspace(mesh.ymin(), mesh.ymax(), ny))
U = X.copy()
V = X.copy()
for i, row in enumerate(X):
for j in range(len(row)):
p = [X[i, j], Y[i, j]]
gr = [0.0, 0.0]
c = mesh.findCell(p)
if c:
gr = c.grad(p, u)
U[i, j] = -gr[0]
V[i, j] = -gr[1]
gci = ax.streamplot(X, Y, U, V, **kwargs)
updateAxes_(ax)
return gci
def drawStreamLine_(ax, mesh, c, data, dataMesh=None, linewidth=1.0,
dropTol=0.0, **kwargs):
"""Draw a single streamline.
Draw a single streamline into a given mesh for given data stating at
the center of cell c.
The Streamline will be enlarged until she reached a cell that
already contains a streamline.
TODO
linewidth and color depends on absolute velocity
or background color saturation
Parameters
----------
ax : matplotlib.ax
ax to draw into
mesh : :gimliapi:`GIMLI::Mesh`
2d Mesh to draw the streamline
c : :gimliapi:`GIMLI::Cell`
start cell
data : iterable float | [float, float]
If data is an array (per cell or node) gradients are calculated
otherwise the data will be interpreted as vector field.
dataMesh : :gimliapi:`GIMLI::Mesh` [None]
Optional mesh for the data. If you want high resolution
data to plot on coarse draw mesh.
linewidth : float [1.0]
Streamline linewidth
dropTol : float [0.0]
Don't draw stream lines with velocity lower than drop tolerance.
"""
x, y, v = streamline(mesh, data, startCoord=c.center(), dLengthSteps=5,
dataMesh=dataMesh, maxSteps=10000, verbose=False,
coords=[0, 1])
if 'color' not in kwargs:
kwargs['color'] = 'black'
lines = None
if len(x) > 2:
points = np.array([x, y]).T.reshape(-1, 1, 2)
segments = np.concatenate([points[:-1], points[1:]], axis=1)
lwidths = pg.RVector(len(v), linewidth)
lwidths[pg.find(pg.RVector(v) < dropTol)] = 0.0
lines = mpl.collections.LineCollection(
segments, linewidths=lwidths, **kwargs)
ax.add_collection(lines)
# probably the limits are wrong without plot call
# lines = ax.plot(x, y, **kwargs)
# updateAxes_(ax, lines)
# ax.plot(x, y, '.-', color='black', **kwargs)
if len(x) > 3:
xmid = int(len(x) / 2)
ymid = int(len(y) / 2)
dx = x[xmid + 1] - x[xmid]
dy = y[ymid + 1] - y[ymid]
c = mesh.findCell([x[xmid], y[ymid]])
# dLength = c.center().dist(c.node(0).pos()) / 4. # NOT USED
if v[xmid] > dropTol:
# ax.arrow(x[xmid], y[ymid], dx, dy,
# #width=dLength / 3.,
# width=0,
# head_width=0.01,
# head_length=0.02
# # head_width=dLength / 3.,
# # head_length=dLength / 3.,
# head_starts_at_zero=True,
# length_includes_head=False,
# lw=4,
# ls=None,
# **kwargs)
dx90 = -dy
dy90 = dx
aLen = 3
aWid = 1
xy = list(zip([x[xmid] + dx90*aWid, x[xmid] + dx*aLen,
x[xmid] - dx90*aWid],
[y[ymid] + dy90*aWid, y[ymid] + dy*aLen,
y[ymid] - dy90*aWid]))
arrow = mpl.patches.Polygon(xy, ls=None, lw=0, closed=True,
**kwargs)
# arrow = mpl.collections.PolyCollection(xy, lines=None,
# closed=True, **kwargs)
ax.add_patch(arrow)
return lines
[docs]def drawStreams(ax, mesh, data, startStream=3, **kwargs):
"""Draw streamlines based on an unstructured mesh.
Every cell contains only one streamline and every new stream line
starts in the center of a cell. You can alternatively provide a second mesh
with coarser mesh to draw streams for.
Parameters
----------
ax : matplotlib.ax
ax to draw into
mesh : :gimliapi:`GIMLI::Mesh`
2d Mesh to draw the streamline
data : iterable float | [float, float] | pg.R3Vector
If data is an array (per cell or node) gradients are calculated
otherwise the data will be interpreted as vector field.
startStream : int
variate the start stream drawing, try values from 1 to 3 what every
you like more.
**kwargs: forward to drawStreamLine_
* coarseMesh
Instead of draw a stream for every cell in mesh, draw a streamline
segment for each cell in coarseMesh.
* quiver: bool
Draw arrows instead of streamlines.
Examples
--------
>>> import numpy as np
>>> import matplotlib.pyplot as plt
>>> import pygimli as pg
>>> from pygimli.mplviewer import drawStreams
>>> n = np.linspace(0, 1, 10)
>>> mesh = pg.createGrid(x=n, y=n)
>>> nx = pg.x(mesh.positions())
>>> ny = pg.y(mesh.positions())
>>> data = np.cos(1.5 * nx) * np.sin(1.5 * ny)
>>> fig, ax = plt.subplots()
>>> drawStreams(ax, mesh, data, color='red')
>>> drawStreams(ax, mesh, data, dropTol=0.9)
>>> drawStreams(ax, mesh, pg.solver.grad(mesh, data),
... color='green', quiver=True)
>>> ax.set_aspect('equal')
>>> pg.wait()
"""
viewMesh = None
dataMesh = None
quiver = kwargs.pop('quiver', False)
if quiver:
x = None
y = None
u = None
v = None
if len(data) == mesh.nodeCount():
x = pg.x(mesh.positions())
y = pg.y(mesh.positions())
elif len(data) == mesh.cellCount():
x = pg.x(mesh.cellCenters())
y = pg.y(mesh.cellCenters())
elif len(data) == mesh.boundaryCount():
x = pg.x(mesh.boundaryCenters())
y = pg.y(mesh.boundaryCenters())
if isinstance(data, pg.R3Vector):
u = pg.x(data)
v = pg.y(data)
else:
u = data[:, 0]
v = data[:, 1]
ax.quiver(x, y, u, v, **kwargs)
updateAxes_(ax)
return
if 'coarseMesh' in kwargs:
viewMesh = kwargs['coarseMesh']
dataMesh = mesh
dataMesh.createNeighbourInfos()
del kwargs['coarseMesh']
else:
viewMesh = mesh
viewMesh.createNeighbourInfos()
for c in viewMesh.cells():
c.setValid(True)
if startStream == 1:
# start a stream from each boundary cell
for y in np.linspace(viewMesh.ymin(), viewMesh.ymax(), 100):
c = viewMesh.findCell(
[(viewMesh.xmax() - viewMesh.xmax()) / 2.0, y])
if c is not None:
if c.valid():
drawStreamLine_(ax, viewMesh, c, data, dataMesh, **kwargs)
elif startStream == 2:
# start a stream from each boundary cell
for x in np.linspace(viewMesh.xmin(), viewMesh.xmax(), 100):
c = viewMesh.findCell(
[x, (viewMesh.ymax() - viewMesh.ymax()) / 2.0])
if c is not None:
if c.valid():
drawStreamLine_(ax, viewMesh, c, data, dataMesh, **kwargs)
elif startStream == 3:
# start a stream from each boundary cell
for b in viewMesh.findBoundaryByMarker(1, 99):
c = b.leftCell()
if c is None:
c = b.rightCell()
if c.valid():
drawStreamLine_(ax, viewMesh, c, data, dataMesh, **kwargs)
# start a stream from each unused cell
for c in viewMesh.cells():
if c.valid():
drawStreamLine_(ax, viewMesh, c, data, dataMesh, **kwargs)
for c in viewMesh.cells():
c.setValid(True)
updateAxes_(ax)
[docs]def drawSensors(ax, sensors, diam=None, coords=None, verbose=False, **kwargs):
"""Draw sensor positions as black dots with a given diameter.
Parameters
----------
sensors : vector or list of RVector3
list of positions to plot
diam : float [None]
diameter of circles (None leads to point distance by 8)
coords: (int, int) [0, 1]
Coordinates to take (usually x and y)
Examples
--------
>>> import numpy as np
>>> import matplotlib.pyplot as plt
>>> import pygimli as pg
>>> from pygimli.mplviewer import drawSensors
>>> sensors = np.random.rand(5, 2)
>>> fig, ax = pg.plt.subplots()
>>> drawSensors(ax, sensors, diam=0.02, coords=[0, 1])
>>> ax.set_aspect('equal')
>>> pg.wait()
"""
if coords is None:
coords = [0, 2]
if pg.yVari(sensors):
coords = [0, 1]
eCircles = []
if diam is None:
eSpacing = sensors[0].distance(sensors[1])
diam = eSpacing / 8.0
for i, e in enumerate(sensors):
if verbose:
print(e, diam, e[coords[0]], e[coords[1]])
eCircles.append(
mpl.patches.Circle((e[coords[0]], e[coords[1]]), diam, **kwargs))
p = mpl.collections.PatchCollection(eCircles, **kwargs)
p.set_zorder(100)
ax.add_collection(p)
updateAxes_(ax)
def _createParameterContraintsLines(mesh, cMat, cWeight=None):
"""TODO Documentme."""
C = pg.RMatrix()
if isinstance(cMat, pg.SparseMapMatrix):
cMat.save('tmpC.matrix')
pg.loadMatrixCol(C, 'tmpC.matrix')
else:
C = cMat
cellList = dict()
for c in mesh.cells():
pID = c.marker()
if pID not in cellList:
cellList[pID] = []
cellList[pID].append(c)
paraCenter = dict()
for pID, vals in list(cellList.items()):
p = pg.RVector3(0.0, 0.0, 0.0)
for c in vals:
p += c.center()
p /= float(len(vals))
paraCenter[pID] = p
nConstraints = C[0].size()
start = []
end = []
# swatch = pg.Stopwatch(True) # not used
for i in range(0, int(nConstraints / 2)):
# print i
# if i == 3: break;
idL = int(C[1][i * 2])
idR = int(C[1][i * 2 + 1])
p1 = paraCenter[idL]
p2 = paraCenter[idR]
if cWeight is not None:
pa = pg.RVector3(p1 + (p2 - p1) / 2.0 * (1.0 - cWeight[i]))
pb = pg.RVector3(p2 + (p1 - p2) / 2.0 * (1.0 - cWeight[i]))
else:
pa = p1
pb = p2
# print(i, idL, idR, p1, p2)
start.append(pa)
end.append(pb)
# updateAxes_(ax) # not existing
return start, end
[docs]def drawParameterConstraints(ax, mesh, cMat, cWeight=None):
"""Draw inter parameter constraints between cells.
Parameters
----------
ax : MPL axes
mesh :
"""
start, end = _createParameterContraintsLines(mesh, cMat, cWeight)
lines = []
colors = []
linewidths = []
for i, _ in enumerate(start):
lines.append(list(zip([start[i].x(), end[i].x()],
[start[i].y(), end[i].y()])))
linewidth = 0.5
col = (0.0, 0.0, 1.0, 1.0)
colors.append(col)
linewidths.append(linewidth)
linCol = mpl.collections.LineCollection(lines, antialiaseds=True)
linCol.set_color(colors)
linCol.set_linewidth(linewidths)
ax.add_collection(linCol)
updateAxes_(ax)