pygimli.utils#
Useful utility functions.
Overview#
Functions
|
Transform any Gauss-Krueger to UTM autodetect GK zone from offset. |
|
Return real/imaginary parts retrieved by Kramers-Kronig relations. |
|
Print string centered in a box. |
|
Return default colormap for physical quantity name. |
|
Cache decorator. |
|
Return chi square value. |
|
Return default colormap for physical quantity name. |
|
Compute inverse square root (C^{-0.5} of matrix. |
|
Converts CRS indices to uncompressed indices (row, col). |
|
Geostatistical covariance matrix (cell or node) for given mesh. |
|
Return datetime as string (e.g. for saving results). |
|
|
|
Create the path structure specified by list. |
|
|
|
Create a result Folder. |
|
|
|
The progressive, i.e., cumulative length for a path p. |
|
Cut array v into n parts. |
|
Calculate approximate derivative. |
|
Calculate the distance for each position in p relative to pos c(x,y,z). |
|
TODO DOCUMENTME. |
|
Filter lines from file.readlines() beginning with symbols in comment. |
|
TODO DOCUMENTME. |
|
Find utm zone for lon and lat values. |
|
Generate geostatistical model (cell or node) for given mesh. |
|
TODO DOCUMENTME. |
|
Syntactic sugar to get some default Projections. |
|
TODO. |
|
Create and return the current coordinate projection. |
|
Convert pygimli matrix into numpy.array. |
|
Create array with possible increasing spacing. |
|
Filter coefficients for Hankel transformation. |
|
numpy.interp interpolation function extended by linear extrapolation. |
|
Return symmetric interpercentiles for alpha-trim outliers. |
|
Return point of integral (cumulative) histogram. |
|
Check numpy or pg.Vector if have complex data type |
|
Find parameter bounds by iterating model parameter. |
|
Create logarithmic scaled copy of p. |
|
Formal model covariance matrix (MCM) from inversion. |
Formal model resolution matrix (MRM) from inversion. |
|
|
Compute the root mean square excluding nan values. |
|
Nice logarithmic space from decade < vMin to decade > vMax. |
|
|
|
List of strings (deprecated, for backward-compatibility). |
|
Convert numpy.array into pygimli RMatrix. |
|
Return prettified string for value . |
|
Return prettified string for a float value. |
|
Return prettified time in seconds as string. |
|
Create RVector of length n with normally distributed random numbers. |
|
Create n normally distributed random numbers with optional seed. |
|
Extract GPS Waypoint from GPS Exchange Format (GPX). |
|
Compute the root mean square. |
|
Compute (abs-)root-mean-square of values with error above threshold. |
|
Compute (abs-)root-mean-square of values with error above threshold. |
|
Round float using a number of counting digits. |
|
Compute the relative (regarding a) root mean square. |
|
Save rms/chi2 results into filename. |
|
Extract indices and value from sparse matrix (SparseMap or CRS) |
|
Convert sparse matrix to dense ndarray |
|
Convert SparseMatrix to scipy.coo_matrix. |
Convert SparseMatrix to scipy.csr_matrix. |
|
|
Squeeze complex valued array into [real, imag] or [amp, phase(rad)] |
|
|
|
Create a streamline from start coordinate and following a vector field in up and down direction. |
|
down = -1, up = 1, both = 0 |
|
|
|
|
|
Convert real values into complex (z = a + ib) valued array. |
|
Convert complex (z = a + ib) values array into amplitude and phase in radiant |
|
Convert complex valued matrix into a real valued Blockmatrix |
Convert any matrix type to pg.SparseMatrix and return copy of it. |
|
Convert any matrix type to pg.SparseMatrix and return copy of it. |
|
|
Return properly formatted docstring. |
|
TODO DOCUMENTME. |
|
Return list of unique elements ever seen with preserving order. |
|
Sum double values found by indices in a various number of arrays. |
|
Return iterator of unique elements ever seen with preserving order. |
|
Return the name of a physical quantity with its unit. |
Classes
|
Interpolation class for digital elevation models. |
|
Animated text-based progress bar. |
Functions#
- pygimli.utils.GKtoUTM(ea, no=None, zone=32, gk=None, gkzone=None)[source]#
Transform any Gauss-Krueger to UTM autodetect GK zone from offset.
- pygimli.utils.KramersKronig(f, re, im, usezero=False)[source]#
Return real/imaginary parts retrieved by Kramers-Kronig relations.
formulas including singularity removal according to Boukamp (1993)
- pygimli.utils.boxprint(s, width=80, sym='#')[source]#
Print string centered in a box.
Examples
>>> from pygimli.utils import boxprint
>>> boxprint("This is centered in a box.", width=40, sym='+')
++++++++++++++++++++++++++++++++++++++++
+      This is centered in a box.      +
++++++++++++++++++++++++++++++++++++++++
- pygimli.utils.cMap(name)#
Return default colormap for physical quantity name.
- pygimli.utils.computeInverseRootMatrix(CM, thrsh=0.001, verbose=False)[source]#
Compute inverse square root (C^{-0.5} of matrix.
- pygimli.utils.convertCRSIndex2Map(rowIdx, colPtr)[source]#
Converts CRS indices to uncompressed indices (row, col).
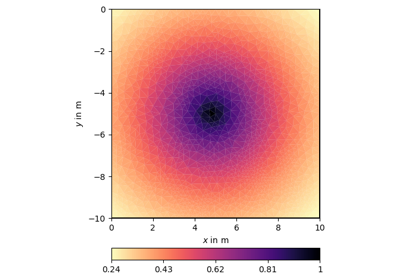
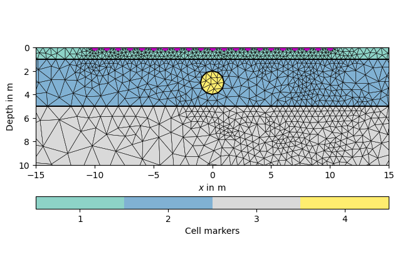
- pygimli.utils.covarianceMatrix(mesh, nodes=False, **kwargs)[source]#
Geostatistical covariance matrix (cell or node) for given mesh.
- Parameters:
mesh (gimliapi:GIMLI::Mesh) – Mesh
nodes (bool [False]) – use node positions, otherwise (default) cell centers are used
**kwargs –
- Ifloat or list of floats
correlation lengths (range) in individual directions
- dipfloat
dip angle (in degree) of major axis (I[0])
- strikefloat
strike angle (for 3D)
- Returns:
Cm – covariance matrix
- Return type:
np.array (square matrix of size cellCount/nodeCount)
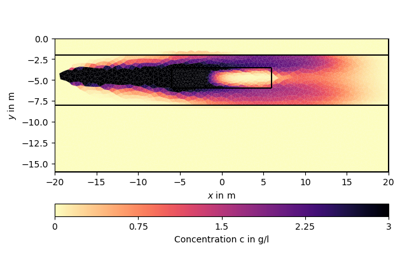
Examples using pygimli.utils.covarianceMatrix
- pygimli.utils.createDateTimeString(now=None)[source]#
Return datetime as string (e.g. for saving results).
- pygimli.utils.createFolders(*args, **kwargs)#
- pygimli.utils.createResultFolder(*args, **kwargs)#
- pygimli.utils.createfolders(*args, **kwargs)#
- pygimli.utils.cumDist(p)[source]#
The progressive, i.e., cumulative length for a path p.
d = [0.0, d[0]+ | p[1]-p[0] |, d[1] + | p[2]-p[1] | + …]
- Parameters:
p (ndarray(N,2) | ndarray(N,3) | pg.PosVector) – Position array
- Returns:
d – Distance array
- Return type:
ndarray(N)
Examples
>>> import pygimli as pg
>>> from pygimli.utils import cumDist
>>> import numpy as np
>>> p = pg.PosVector(4)
>>> p[0] = [0.0, 0.0]
>>> p[1] = [0.0, 1.0]
>>> p[2] = [0.0, 1.0]
>>> p[3] = [0.0, 0.0]
>>> print(cumDist(p))
[0. 1. 1. 2.]
- pygimli.utils.diff(v)[source]#
Calculate approximate derivative.
Calculate approximate derivative from v as d = [v_1-v_0, v2-v_1, …]
- Parameters:
v (array(N) | pg.PosVector(N)) – Array of double values or positions
- Returns:
d – derivative array
- Return type:
[type(v)](N-1) |
Examples
>>> import pygimli as pg
>>> from pygimli.utils import diff
>>> p = pg.PosVector(4)
>>> p[0] = [0.0, 0.0]
>>> p[1] = [0.0, 1.0]
>>> print(diff(p)[0])
RVector3: (0.0, 1.0, 0.0)
>>> print(diff(p)[1])
RVector3: (0.0, -1.0, 0.0)
>>> print(diff(p)[2])
RVector3: (0.0, 0.0, 0.0)
>>> p = pg.Vector(3)
>>> p[0] = 0.0
>>> p[1] = 1.0
>>> p[2] = 2.0
>>> print(diff(p))
2 [1.0, 1.0]
- pygimli.utils.dist(p, c=None)[source]#
Calculate the distance for each position in p relative to pos c(x,y,z).
- Parameters:
p (ndarray(N,2) | ndarray(N,3) | pg.PosVector) – Position array
c ([x,y,z] [None]) – relative origin. default = [0, 0, 0]
- Returns:
d – Distance array
- Return type:
ndarray(N)
Examples
>>> import pygimli as pg
>>> from pygimli.utils import dist
>>> import numpy as np
>>> p = pg.PosVector(4)
>>> p[0] = [0.0, 0.0]
>>> p[1] = [0.0, 1.0]
>>> print(dist(p))
[0. 1. 0. 0.]
>>> x = pg.Vector(4, 0)
>>> y = pg.Vector(4, 1)
>>> print(dist(np.array([x, y]).T))
[1. 1. 1. 1.]
- pygimli.utils.filterLinesByCommentStr(lines, comment_str='#')[source]#
Filter lines from file.readlines() beginning with symbols in comment.
- pygimli.utils.findUTMZone(lon, lat)[source]#
Find utm zone for lon and lat values.
lon -180 – -174 -> 1 … 174 – 180 -> 60 lat < 0 hemisphere = S, > 0 hemisphere = N
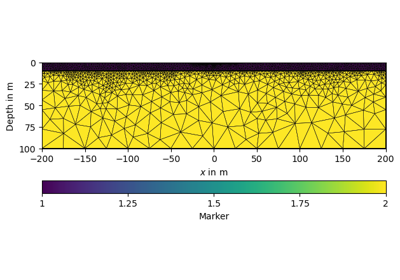
- pygimli.utils.generateGeostatisticalModel(mesh, nodes=False, seed=None, **kwargs)[source]#
Generate geostatistical model (cell or node) for given mesh.
- Parameters:
mesh (gimliapi:GIMLI::Mesh) – Mesh
nodes (bool [False]) – use node positions, otherwise (default) cell centers are used
seed (int, array_like[ints], SeedSequence, BitGenerator, Generator}, optional) – A seed to initialize the BitGenerator. If None, then fresh, unpredictable entropy will be used. The seed variable is passed to
numpy.random.default_rng()**kwargs –
- Ifloat or list of floats
correlation lengths (range) in individual directions
- dipfloat
dip angle of major axis (I[0])
- strikefloat
strike angle (for 3D)
- Returns:
res
- Return type:
np.array of size cellCount or nodeCount (nodes=True)
Examples using pygimli.utils.generateGeostatisticalModel
- pygimli.utils.getProjection(name, ref=None, **kwargs)[source]#
Syntactic sugar to get some default Projections.
- pygimli.utils.getUTMProjection(zone, ellps='WGS84')[source]#
Create and return the current coordinate projection.
This is a proxy for pyproj.
- pygimli.utils.gmat2numpy(mat)[source]#
Convert pygimli matrix into numpy.array.
TODO implement correct rval
- pygimli.utils.grange(start, end, dx=0, n=0, log=False)[source]#
Create array with possible increasing spacing.
Create either array from start step-wise filled with dx until end reached [start, end] (like np.array with defined end). Fill the array from start to end with n steps. [start, end] (like np.linespace) Fill the array from start to end with n steps but logarithmic increasing, dx will be ignored.
- Parameters:
Examples
>>> from pygimli.utils import grange
>>> v1 = grange(start=0, end=10, dx=3)
>>> v2 = grange(start=0, end=10, n=3)
>>> print(v1)
4 [0.0, 3.0, 6.0, 9.0]
>>> print(v2)
3 [0.0, 5.0, 10.0]
- Returns:
ret – Return resulting array
- Return type:
GIMLI::RVector
Examples using pygimli.utils.grange
- pygimli.utils.hankelFC(order)[source]#
Filter coefficients for Hankel transformation.
10 data points per decade.
DOCUMENTME .. Author RUB?
- Parameters:
order (int) – order=1: NY=+0.5 (SIN) order=2: NY=-0.5 (COS) order=3: NY=0.0 (J0) order=4: NY=1.0 (J1)
- Returns:
fc (np.array()) – Filter coefficients
nc0 (int) – fc[nc0] refers to zero argument
- pygimli.utils.interpExtrap(x, xp, yp)[source]#
numpy.interp interpolation function extended by linear extrapolation.
- pygimli.utils.interperc(a, trimval=3.0, islog=False, bins=None)[source]#
Return symmetric interpercentiles for alpha-trim outliers.
E.g. interperc(a, 3) returns range of inner 94% (3 to 97%) which is particularly useful for colorscales).
- pygimli.utils.inthist(a, vals, bins=None, islog=False)[source]#
Return point of integral (cumulative) histogram.
E.g. inthist(a, [25, 50, 75]) provides quartiles and median of an array
- pygimli.utils.iterateBounds(inv, dchi2=0.5, maxiter=100, change=1.02)[source]#
Find parameter bounds by iterating model parameter.
Find parameter bounds by iterating model parameter until error bound is reached
- Parameters:
inv – gimli inversion object
dchi2 – allowed variation of chi^2 values [0.5]
maxiter – maximum iteration number for parameter iteration [100]
change – changing factor of parameters [1.02, i.e. 2%]
- pygimli.utils.logDropTol(p, dropTol=0.001)[source]#
Create logarithmic scaled copy of p.
Examples
>>> from pygimli.utils import logDropTol
>>> x = logDropTol((-10, -1, 0, 1, 100))
>>> print(x.array())
[-4. -3.  0.  3.  5.]
Examples using pygimli.utils.logDropTol
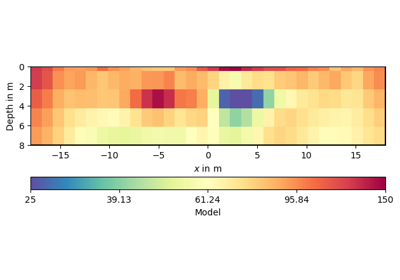
- pygimli.utils.modelCovariance(inv)[source]#
Formal model covariance matrix (MCM) from inversion.
- Parameters:
inv (pygimli inversion object)
- Returns:
var (variances (inverse square roots of MCM matrix))
MCMs (scaled MCM (such that diagonals are 1.0))
Examples
>>> # import pygimli as pg
>>> # import matplotlib.pyplot as plt
>>> # from matplotlib.cm import bwr
>>> # INV = pg.Inversion(data, f)
>>> # par = INV.run()
>>> # var, MCM = modCovar(INV)
>>> # i = plt.imshow(MCM, interpolation='nearest',
>>> #                 cmap=bwr, vmin=-1, vmax=1)
>>> # plt.colorbar(i)
- pygimli.utils.modelResolutionMatrix(inv)[source]#
Formal model resolution matrix (MRM) from inversion.
- Parameters:
inv (pg.Inversion (pygimli.framework.Inversion))
- Returns:
MR
- Return type:
pg.Matrix (pg.matrix.core.RMatrix dense matrix)
- pygimli.utils.niceLogspace(vMin, vMax, nDec=10)[source]#
Nice logarithmic space from decade < vMin to decade > vMax.
- Parameters:
Examples
>>> from pygimli.utils import niceLogspace
>>> v1 = niceLogspace(vMin=0.1, vMax=0.1, nDec=1)
>>> print(v1)
[0.1 1. ]
>>> v1 = niceLogspace(vMin=0.09, vMax=0.11, nDec=1)
>>> print(v1)
[0.01 0.1  1.  ]
>>> v1 = niceLogspace(vMin=0.09, vMax=0.11, nDec=10)
>>> print(len(v1))
21
>>> print(v1)
[0.01       0.01258925 0.01584893 0.01995262 0.02511886 0.03162278
 0.03981072 0.05011872 0.06309573 0.07943282 0.1        0.12589254
 0.15848932 0.19952623 0.25118864 0.31622777 0.39810717 0.50118723
 0.63095734 0.79432823 1.        ]
- pygimli.utils.num2str(a, fmtstr='%g')[source]#
List of strings (deprecated, for backward-compatibility).
- pygimli.utils.numpy2gmat(nmat)[source]#
Convert numpy.array into pygimli RMatrix.
TODO implement correct rval
- pygimli.utils.prettify(value, roundValue=False)[source]#
Return prettified string for value .. if possible.
- pygimli.utils.prettyFloat(value, roundValue=None)[source]#
Return prettified string for a float value.
- pygimli.utils.prettyTime(t)[source]#
Return prettified time in seconds as string. No months, no leap year.
- Parameters:
t (float) – Time in seconds, should be > 0
Examples
>>> from pygimli.utils import prettyTime
>>> print(prettyTime(1))
1 s
>>> print(prettyTime(3600*24))
1 day
>>> print(prettyTime(2*3600*24))
2 days
>>> print(prettyTime(365*3600*24))
1 year
>>> print(prettyTime(3600))
1 hour
>>> print(prettyTime(2*3600))
2 hours
>>> print(prettyTime(3660))
1h1m
>>> print(prettyTime(1e-3))
1 ms
>>> print(prettyTime(1e-6))
1 µs
>>> print(prettyTime(1e-9))
1 ns
- pygimli.utils.rand(n, minVal=0.0, maxVal=1.0, seed=None)[source]#
Create RVector of length n with normally distributed random numbers.
- pygimli.utils.randn(n, seed=None)[source]#
Create n normally distributed random numbers with optional seed.
- Parameters:
n (long) – length of random numbers array.
seed (int[None]) – Optional seed for random number generator
- Returns:
r – Random numbers.
- Return type:
np.array
Examples
>>> import numpy as np
>>> from pygimli.utils import randn
>>> a = randn(5, seed=1337)
>>> b = randn(5)
>>> c = randn(5, seed=1337)
>>> print(np.array_equal(a, b))
False
>>> print(np.array_equal(a, c))
True
- pygimli.utils.readGPX(fileName)[source]#
Extract GPS Waypoint from GPS Exchange Format (GPX).
Currently only simple waypoint extraction is supported.
<gpx version=”1.0” creator=”creator”>
<metadata> <name>Name</name> </metadata> <wpt lat=”51.” lon=”11.”> <name>optional</name> <time>optional</time> <description>optional</description> </wpt>
</gpx>
- pygimli.utils.rmsWithErr(a, b, err, errtol=1)[source]#
Compute (abs-)root-mean-square of values with error above threshold.
- pygimli.utils.rmswitherr(a, b, err, errtol=1)#
Compute (abs-)root-mean-square of values with error above threshold.
- pygimli.utils.saveResult(fname, data, rrms=None, chi2=None, mode='w')[source]#
Save rms/chi2 results into filename.
- pygimli.utils.sparseMatrix2Array(matrix, indices=True, getInCRS=True)[source]#
Extract indices and value from sparse matrix (SparseMap or CRS)
Get python Arrays from SparseMatrix or SparseMapMatrix in either CRS convention (row index, column Start_End, values) or row index, column index, values.
- Parameters:
matrix (pg.matrix.SparseMapMatrix or pg.matrix.SparseMatrix) – Input matrix to be transformed to numpy arrays.
indices (boolean (True)) – Decides weather the indices of the matrix will be returned or not.
getInCSR (boolean (True)) – If returned, the indices can have the format of a compressed row storage (CSR), the default or uncompressed lists with column and row indices.
- Returns:
vals (numpy.ndarray) – Entries of the matrix.
indices (list, list) – Optional. Returns additional array with the indices for reconstructing the matrix in the defined format.
- pygimli.utils.sparseMatrix2coo(A, rowOffset=0, colOffset=0)[source]#
Convert SparseMatrix to scipy.coo_matrix.
- Parameters:
A (pg.matrix.SparseMapMatrix | pg.matrix.SparseMatrix) – Matrix to convert from.
- Returns:
mat – Matrix to convert into.
- Return type:
scipy.coo_matrix
Examples using pygimli.utils.sparseMatrix2coo
- pygimli.utils.sparseMatrix2csr(A)[source]#
Convert SparseMatrix to scipy.csr_matrix.
Compressed Sparse Row matrix, i.e., Compressed Row Storage (CRS)
- Parameters:
A (pg.matrix.SparseMapMatrix | pg.matrix.SparseMatrix) – Matrix to convert from.
- Returns:
mat – Matrix to convert into.
- Return type:
scipy.csr_matrix
- pygimli.utils.squeezeComplex(z, polar=False, conj=False)[source]#
Squeeze complex valued array into [real, imag] or [amp, phase(rad)]
Examples using pygimli.utils.squeezeComplex
- pygimli.utils.streamline(mesh, field, startCoord, dLengthSteps, dataMesh=None, maxSteps=1000, verbose=False, coords=(0, 1))[source]#
Create a streamline from start coordinate and following a vector field in up and down direction.
- pygimli.utils.streamlineDir(mesh, field, startCoord, dLengthSteps, dataMesh=None, maxSteps=150, down=True, verbose=False, coords=(0, 1))[source]#
down = -1, up = 1, both = 0
- pygimli.utils.toComplex(amp, phi=None)[source]#
Convert real values into complex (z = a + ib) valued array.
If no phases phi are given, assuming z = amp[0:N] + i amp[N:2N].
If phi is given in (rad) complex values are generated: z = amp*(cos(phi) + i sin(phi))
Examples using pygimli.utils.toComplex
- pygimli.utils.toPolar(z)[source]#
Convert complex (z = a + ib) values array into amplitude and phase in radiant
If z is real valued we assume its squeezed.
- Parameters:
z (iterable (floats, complex)) – If z contains of floats and squeezedComplex is assumed [real, imag]
- Returns:
amp, phi – Amplitude amp and phase angle phi in radiant.
- Return type:
ndarray
- pygimli.utils.toRealMatrix(C, conj=False)[source]#
Convert complex valued matrix into a real valued Blockmatrix
- Parameters:
C (CMatrix) – Complex valued matrix
conj (bool [False]) – Fill the matrix as complex conjugated matrix
- Returns:
R
- Return type:
pg.matrix.BlockMatrix()
- pygimli.utils.toSparseMapMatrix(A)[source]#
Convert any matrix type to pg.SparseMatrix and return copy of it.
- Parameters:
A (pg or scipy matrix)
- Return type:
pg.SparseMatrix
- pygimli.utils.toSparseMatrix(A)[source]#
Convert any matrix type to pg.SparseMatrix and return copy of it.
No conversion if A is a SparseMatrix already :param A: :type A: pg or scipy matrix
- Return type:
pg.SparseMatrix
- pygimli.utils.trimDocString(docstring)[source]#
Return properly formatted docstring.
From: https://www.python.org/dev/peps/pep-0257/
Examples
>>> from pygimli.utils import trimDocString
>>> docstring = '    This is a string with indention and whitespace.   '
>>> trimDocString(docstring).replace('with', 'without')
'This is a string without indention and whitespace.'
- pygimli.utils.unique(a)[source]#
Return list of unique elements ever seen with preserving order.
Examples
>>> from pygimli.utils import unique
>>> unique((1,1,2,2,3,1))
[1, 2, 3]
See also
unique_everseen,unique_rows
- pygimli.utils.uniqueAndSum(indices, to_sum, return_index=False, verbose=False)[source]#
Sum double values found by indices in a various number of arrays.
Returns the sorted unique elements of a column_stacked array of indices. Another column_stacked array is returned with values at the unique indices, while values at double indices are properly summed.
- Parameters:
ar (array_like) – Input array. This will be flattened if it is not already 1-D.
to_sum (array_like) – Input array to be summed over axis 0. Other existing axes will be broadcasted remain untouched.
return_index (bool, optional) – If True, also return the indices of ar (along the specified axis, if provided, or in the flattened array) that result in the unique array.
- Returns:
unique (ndarray) – The sorted unique values.
summed_array (ndarray) – The summed array, whereas all values for a specific index is the sum over all corresponding nonunique values.
unique_indices (ndarray, optional) – The indices of the first occurrences of the unique values in the original array. Only provided if return_index is True.
Examples
>>> import numpy as np
>>> from pygimli.utils import uniqueAndSum
>>> idx1 = np.array([0, 0, 1, 1, 2, 2])
>>> idx2 = np.array([0, 0, 1, 2, 3, 3])
>>> # indices at positions 0 and 1 and at positions 5 and 6 are not unique
>>> to_sort = np.column_stack((idx1, idx2))
>>> # its possible to stack more than two array
>>> # you need for example 3 array to find unique node positions in a mesh
>>> values = np.arange(0.1, 0.7, 0.1)
>>> print(values)
[0.1 0.2 0.3 0.4 0.5 0.6]
>>> # some values to be summed together (for example attributes of nodes)
>>> unique_idx, summed_vals = uniqueAndSum(to_sort, values)
>>> print(unique_idx)
[[0 0]
 [1 1]
 [1 2]
 [2 3]]
>>> print(summed_vals)
[0.3 0.3 0.4 1.1]
- pygimli.utils.unique_everseen(iterable, key=None)[source]#
Return iterator of unique elements ever seen with preserving order.
Return iterator of unique elements ever seen with preserving order.
From: https://docs.python.org/3/library/itertools.html#itertools-recipes
Examples
>>> from pygimli.utils import unique_everseen
>>> s1 = 'AAAABBBCCDAABBB'
>>> s2 = 'ABBCcAD'
>>> list(unique_everseen(s1))
['A', 'B', 'C', 'D']
>>> list(unique_everseen(s2, key=str.lower))
['A', 'B', 'C', 'D']
See also
unique,unique_rows
Classes#
- class pygimli.utils.DEM(demfile, x=None, y=None, **kwargs)[source]#
Bases:
objectInterpolation class for digital elevation models.
- __init__(demfile, x=None, y=None, **kwargs)[source]#
Initialize DGM (regular grid) interpolation object.
- Parameters:
- Keyword Arguments:
toLatLon (callable(x, y) [None]) – Custom coordinate translator. If set to None then lambda x_, y_: utm.to_latlon(x_, y_, zone, ‘N’) is taken.
zone (int [32]) – UTM zone to be chosen
- add(new)[source]#
Combine two DEM by concatenatation.
x or y vectors must be equal (e.g. for 1° SRTM models).
- show(cmap='terrain', cbar=True, ax=None, **kwargs)[source]#
Show digital elevation model (i.e. the elevation map).
- Keyword Arguments:
() (- cmap = "terrain", type str) – matplotlib colormap definiton
bool (- cbar = True, type) – add colorbar to the plot or not
object (- ax = None, type matplotlib figure axes) – add the plot to a given axes object or create a new one
arguments (- **kwargs, type keyword) –
add additional keyword arguments for the plot style (e.g., lw)
- class pygimli.utils.ProgressBar(its, width=80, sign=':', **kwargs)[source]#
Bases:
objectAnimated text-based progress bar.
Animated text-based progressbar for intensive loops. Should work in the console. In IPython Notebooks a ‘tqdm’ progressbar instance is created and can be configured with appropriate keyword arguments.
- __init__(its, width=80, sign=':', **kwargs)[source]#
Create animated text-based progress bar.
optional: ‘estimated time’ instead of ‘x of y complete’
- itsint
Number of iterations of the process.
- widthint
Width of the ProgressBar, default is 80.
- signstr
Sign used to fill the bar.
Forwarded to create the tqdm progressbar instance. See https://tqdm.github.io/docs/tqdm/
>>> from pygimli.utils import ProgressBar
>>> pBar = ProgressBar(its=20, width=40, sign='+')
>>> pBar.update(5)
[+++++++++++ 30% ] 6 of 20 complete